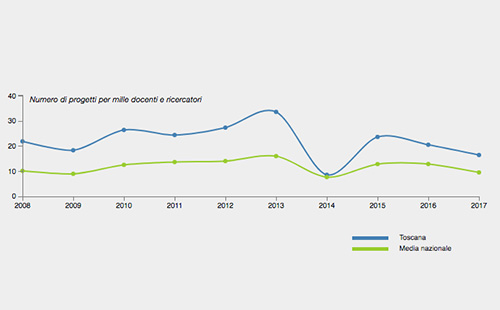
The two graphs show the number of projects funded [...]
H2020 and FP7 for a reference program with at least one Tuscan private sector partner
Riccardo Vannini2024-10-14T08:59:10+00:00The graphs show the level of investment, divided by thematic [...]
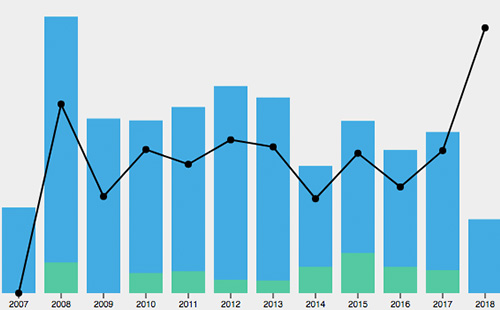
H2020 and FP7 with at least one Tuscan private sector partner
Riccardo Vannini2024-10-14T08:59:18+00:00The graph shows all FP7 and H2020 projects where at [...]
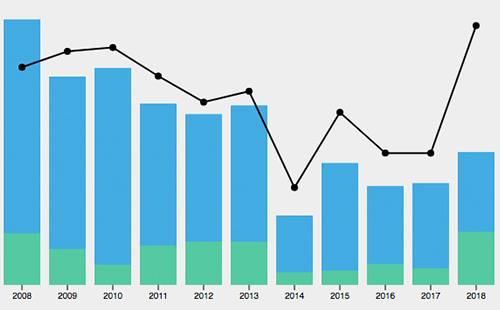
H2020 and FP7 with at least one Tuscan university
Riccardo Vannini2024-10-14T08:59:25+00:00The graph shows all FP7 and H2020 projects involving [...]
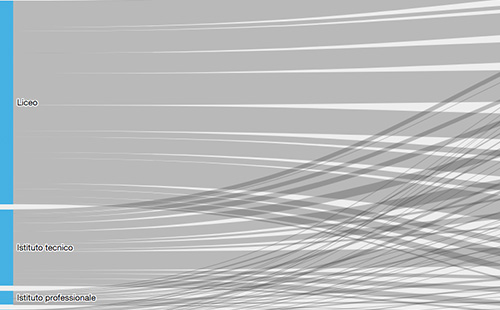
Enrolment by type of diploma and degree class
Riccardo Vannini2018-11-23T13:44:56+00:00The display shows the flow of enrolments by type of [...]
Residents in Tuscany enrolled in universities away from home
Riccardo Vannini2018-11-23T13:40:49+00:00These three graphs explore the flow of residents in Tuscany [...]
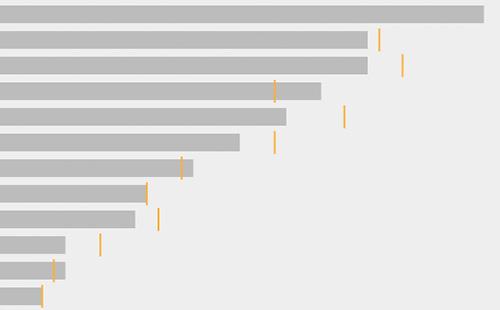
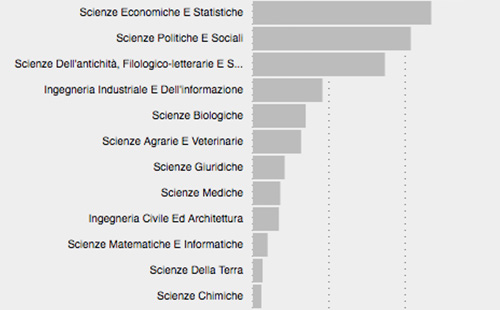
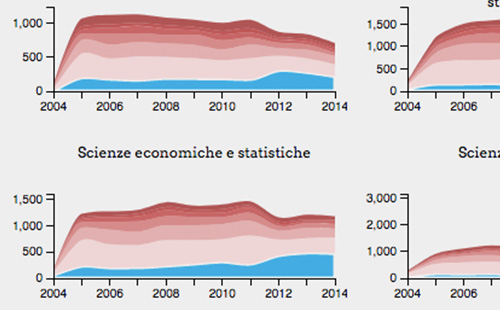
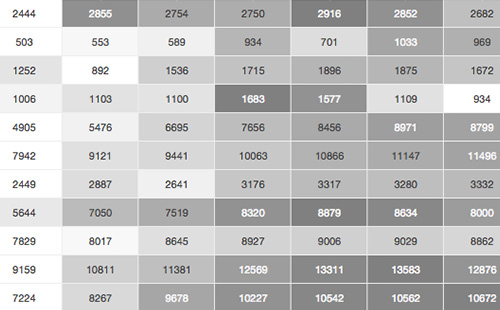
Number of students per teacher and per subject area
Riccardo Vannini2018-11-23T13:37:14+00:00The graph shows the relationship between the number of students [...]
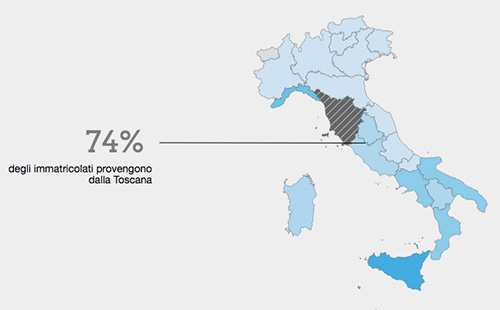
Provenance of enrolled students by province of residence
Riccardo Vannini2018-11-23T13:29:40+00:00The figure shows provenance by geographical area of residence (Region [...]
Three-year graduates
Riccardo Vannini2018-11-23T13:25:58+00:00The graphs below show the number of graduates, undergraduates within [...]
Enrolment trend by degree class
Riccardo Vannini2018-11-23T13:20:33+00:00The graph shows the trend of students registered in all [...]
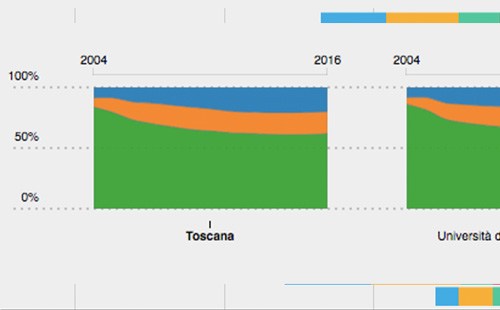
Trends in the number of members by university
Riccardo Vannini2018-11-23T13:16:27+00:00The graphs show the trend of the number of students [...]
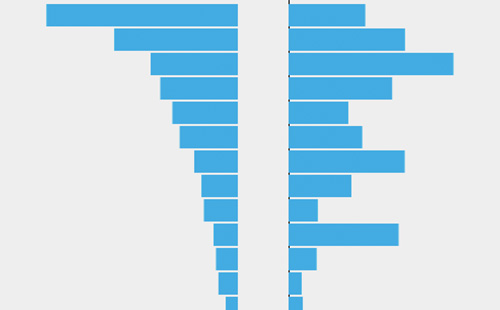
Distribution of professors and researchers by scientific sector
Riccardo Vannini2024-10-14T08:58:59+00:00The graph shows the distribution of teachers and researchers by [...]
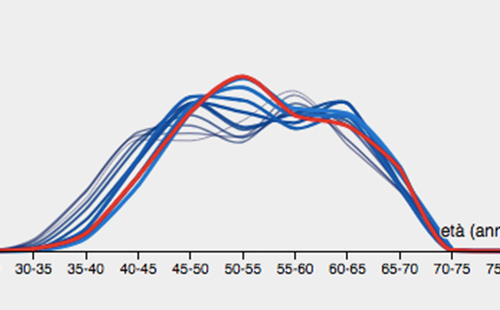
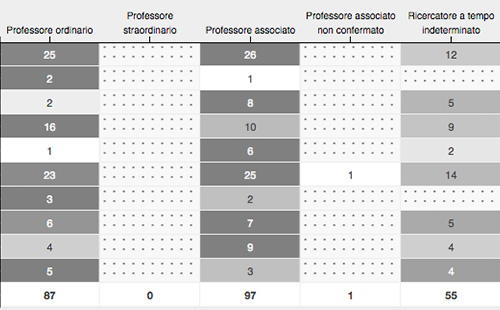
Distribution by age, role and CUN area of teachers and researchers
Riccardo Vannini2024-10-14T08:58:37+00:00The graphs show the average age of teaching staff [...]